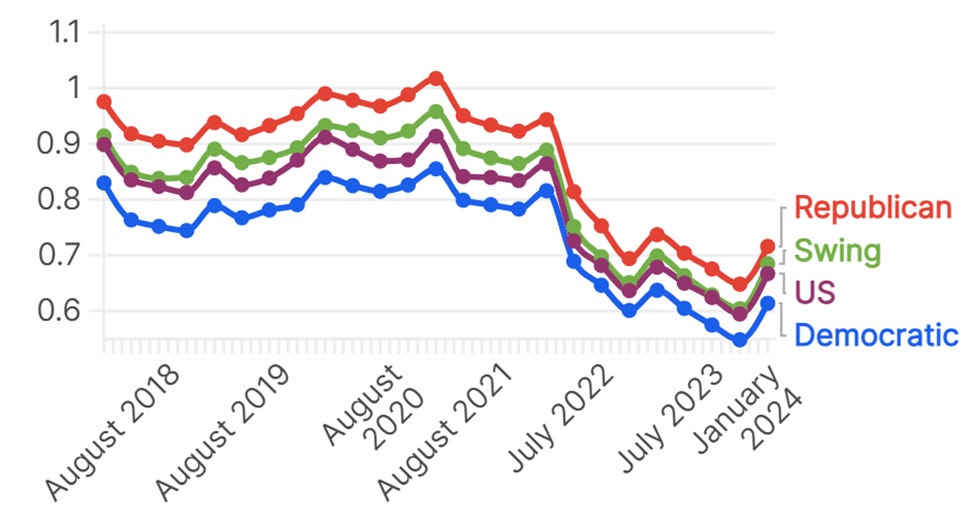
Red States Lead Blue States in Home Affordability
Realtor.com latest Affordability Study found home prices and housing affordability that are emerging as top issues for 2024 voters, are better in Republican Red States and worse in Democrat Blue state.
Based on affordability score data through March, Realtor.com analysts found that housing affordability since 2021 has significantly declined on average across the United States. The survey blamed sharply higher mortgage interest rates that have almost doubled the average monthly payments over the last three years as the primary cause for the nationwide decline in home affordability.
The national decline in U.S. housing affordability has reached its worst levels on record, with listing prices up 28% since January 2021. Furthermore, the national home price-to-income ratio rose from 4.1 times in 2019 to a record high of nearly 6 times last month.
As a result, a national survey last month from the University of Michigan and the Financial Times found that one’s own ability to afford housing was evenly distributed politically, with both 70% of Democrats and Republicans, and independents ranking affordable housing as one of their top concerns.
Realtor.com data demonstrates there are “distinct trends separating red states, blue states, and the seven key swing states: Arizona, Georgia, Michigan, Nevada, North Carolina, Pennsylvania, and Wisconsin.” Red states are more affordable and blue states are less affordable,” while so-called Purple swing states on average are “slightly more affordable than the national average.”
Donald Trump’s key to becoming president in 2016 was winning six of the seven Purple swing states including: Arizona, Georgia, Michigan, North Carolina, Pennsylvania, and Wisconsin. Biden won in 2020 by carrying six of the seven Purple swing states including: Arizona, Georgia, Michigan, Nevada, Pennsylvania, and Wisconsin.
Given the current electoral map polling, it is mathematically impossible for Trump and for Biden to win in 2024 election without carrying at least 3 of the 7 Purple swing states.
Realtor.Com State Housing Affordability Rankings
Rank
Geographic
Likely Vote
Affordability
Median List
Median Income
Average
United States
2024
0.64512256
$424,900.00
$74,755.00
1
Iowa
Republican
0.92582727
$299,900.00
$69,588.00
2
West Virginia
Republican
0.91882509
$239,000.00
$54,329.00
3
Ohio
Republican
0.91681050
$260,000.00
$65,720.00
4
Michigan
Swing State
0.88543493
$275,000.00
$66,986.00
5
Indiana
Republican
0.88012342
$291,500.00
$66,785.00
6
Illinois
Democratic
0.86858768
$316,900.00
$76,708.00
7
Pennsylvania
Swing State
0.83724765
$299,000.00
$71,798.00
8
Kansas
Republican
0.83635423
$314,500.00
$68,925.00
9
Maryland
Democratic
0.83091892
$399,900.00
$94,991.00
10
Missouri
Republican
0.83004164
$299,000.00
$64,811.00
11
Oklahoma
Republican
0.77923136
$297,895.00
$59,673.00
12
Minnesota
Democratic
0.77253270
$399,900.00
$82,338.00
13
Louisiana
Republican
0.76492550
$279,000.00
$55,416.00
14
Kentucky
Republican
0.75635279
$303,900.00
$59,341.00
15
North Dakota
Republican
0.74268605
$349,950.00
$71,970.00
16
Arkansas
Republican
0.74256555
$295,000.00
$55,432.00
17
Alaska
Republican
0.74006816
$399,900.00
$88,121.00
18
Virginia
Democratic
0.73289741
$430,575.00
$85,873.00
19
Mississippi
Republican
0.72653143
$285,000.00
$52,719.00
20
Nebraska
Republican
0.71373625
$358,000.00
$69,597.00
21
Alabama
Republican
0.71143221
$329,645.00
$59,674.00
22
Wisconsin
Swing State
0.68444229
$379,900.00
$70,996.00
23
Connecticut
Democratic
0.65674120
$504,900.00
$88,429.00
24
Wash. DC
Democratic
0.65075097
$615,000.00
$101,027.00
25
Georgia
Swing State
0.64619197
$389,715.00
$72,837.00
26
South Carolina
Republican
0.64426119
$350,000.00
$64,115.00
27
Texas
Republican
0.61238870
$365,000.00
$72,284.00
28
New Hampshire
Democratic
0.60405207
$570,950.00
$89,992.00
29
Delaware
Democratic
0.60113079
$495,000.00
$82,174.00
30
South Dakota
Republican
0.59658472
$379,000.00
$69,728.00
31
Wyoming
Republican
0.59625049
$449,000.00
$70,042.00
32
North Carolina
Swing State
0.59621279
$399,900.00
$67,481.00
33
New Jersey
Democratic
0.59596241
$549,000.00
$96,346.00
34
Maine
Democratic
0.58692307
$435,000.00
$69,543.00
35
Vermont
Democratic
0.58235477
$479,000.00
$73,991.00
36
New Mexico
Democratic
0.57732483
$385,000.00
$59,726.00
37
Tennessee
Republican
0.55651717
$435,000.00
$65,254.00
38
Colorado
Democratic
0.54481029
$599,900.00
$89,302.00
39
Rhode Island
Democratic
0.53460467
$489,000.00
$81,854.00
40
Florida
Republican
0.51170872
$454,900.00
$69,303.00
41
Washington
Democratic
0.50380678
$629,900.00
$91,306.00
42
Nevada
Swing State
0.49484830
$487,000.00
$72,333.00
43
New York
Democratic
0.49291437
$685,000.00
$79,557.00
44
Utah
Republican
0.49070384
$600,000.00
$89,168.00
45
Arizona
Swing State
0.48932255
$500,000.00
$74,568.00
46
Massachusetts
Democratic
0.47483214
$799,900.00
$94,488.00
47
Oregon
Democratic
0.46391444
$550,000.00
$75,657.00
48
Hawaii
Democratic
0.44769239
$845,000.00
$92,458.00
49
California
Democratic
0.43450663
$749,888.00
$91,551.00
50
Idaho
Republican
0.42412121
$565,000.00
$72,785.00
51
Montana
Republican
0.40901426
$625,000.00
$67,631.00
Table: Realtor.comSource: Realtor.com/US Census


